Free · No accounts · Works offline

Pool Captain

A pocket toolkit for league players. Work out your real odds before a match, measure how hard you actually break, rate the table you're stuck on, and log matches so you can see the skill level you're really playing at.

  • Seven tools built around APA handicaps and Fargo ratings
  • Everything stays on your phone — no sign-up, no ads, no tracking
  • Every screen has a plain-language guide explaining the maths
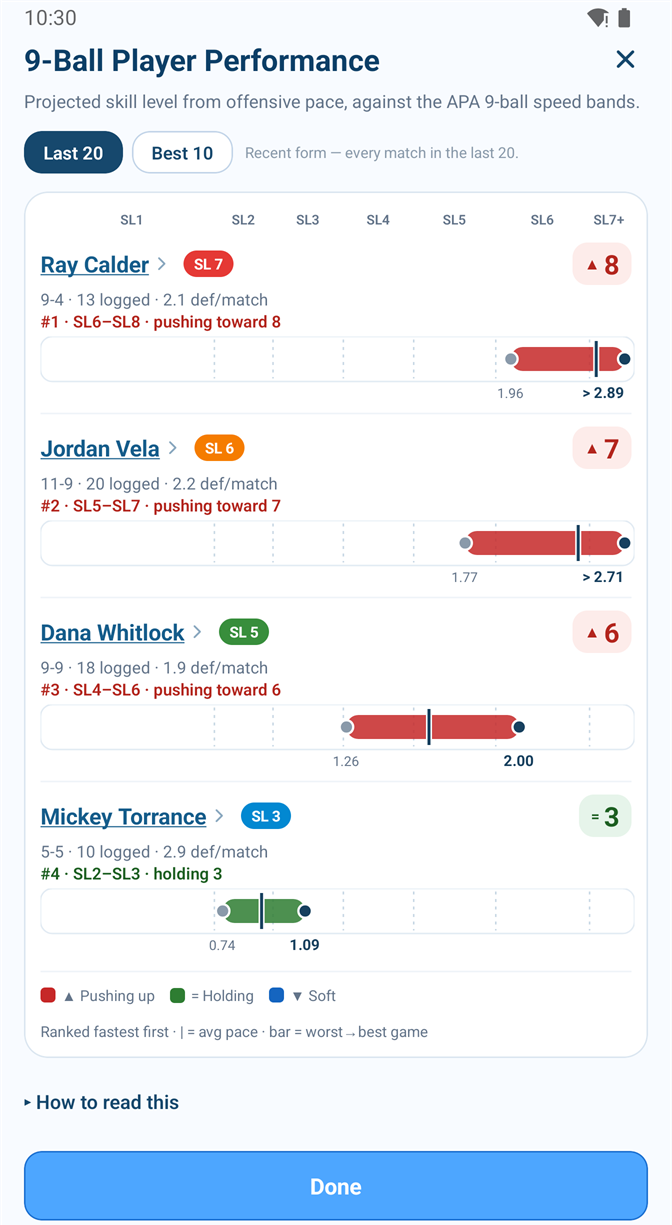
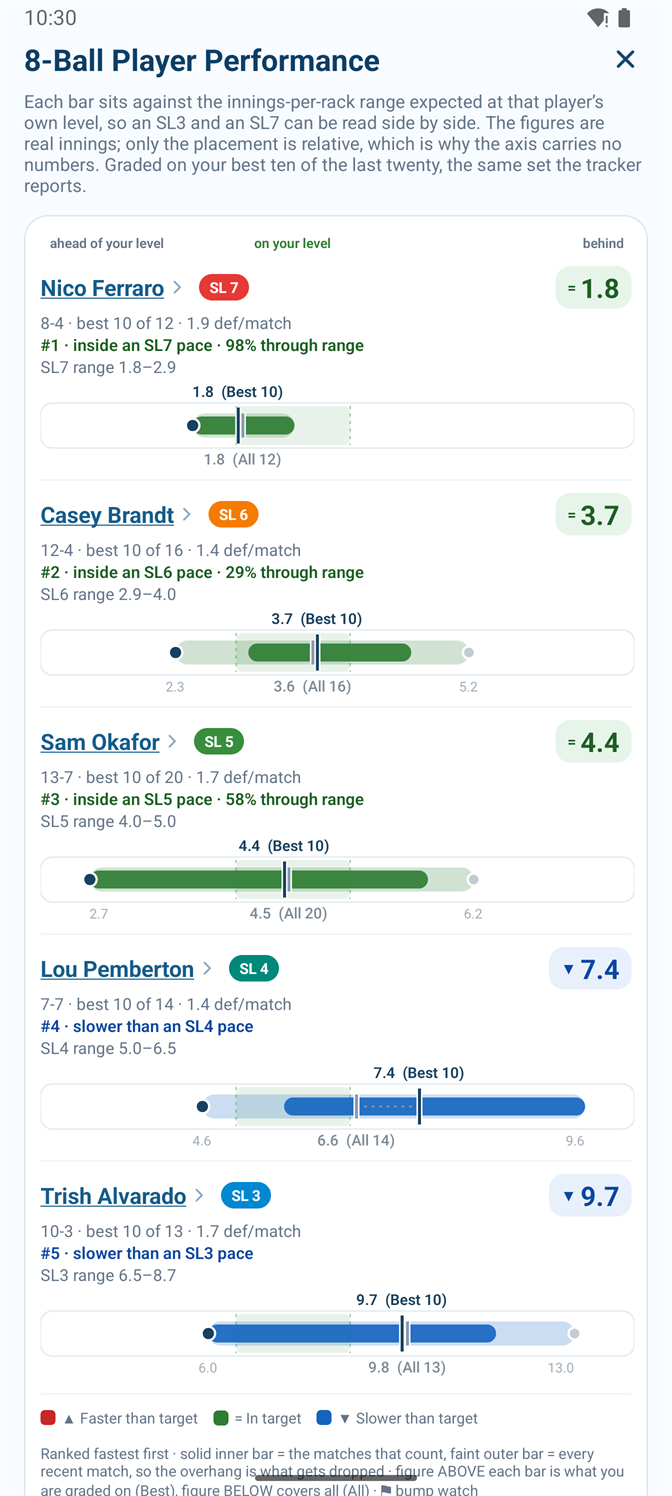
Pool Captain's 8-ball comparison screen, showing five players ranked against the innings-per-rack range expected at their own skill level

I need twelve testers

Pool Captain is finished enough to use in a real match, and now it has to get through Google's closed-testing requirement before it can go on the Play Store.

The short version

Google requires 12 testers who stay opted in for 14 consecutive days before an app from a new personal developer account can be published. That's the whole reason this page exists. You install it, use it on league night, and tell me what broke or annoyed you.

What you need

What testing actually involves

  1. Fill in the sign-up form. Three questions and your email address — a minute, at most. I add that address to the tester list, and nothing appears on your phone until I do, so this step is unavoidable.
  2. Accept the invite and install. You'll get a Play Store link that installs the app like any normal download. It updates itself the same way too.
  3. Use it. Log a couple of matches, measure a few breaks, rate your home table. Poking at it for ten minutes is genuinely enough to be useful.
  4. Stay opted in for 14 days. This is the part Google actually counts. Please don't uninstall inside the two weeks — if you do, the clock resets for everybody.
  5. Tell me what you found. A one-line text is fine. Crashes, numbers that look wrong, wording that made no sense, a break it refused to hear — all of it helps.

What I'd most like feedback on

  • Does the break measurement hear your break in a real, noisy poolroom?
  • Do the skill-level readings from your logged matches match your gut sense of how you're playing?
  • Is anything slow, ugly, or baffling on your particular phone?

Sign up to test

The form is hosted by Google. I use your address for one thing — adding you to the tester list so the app can reach your phone — and I delete the responses when the test closes. If you'd rather not use a form, email me instead.

The seven tools

Four are calculators you use before or during a match. Three are logs that build up a picture over a season. Everything below is a real screenshot of the current build.

Analysis

APA 8 Ball — what this matchup is actually worth

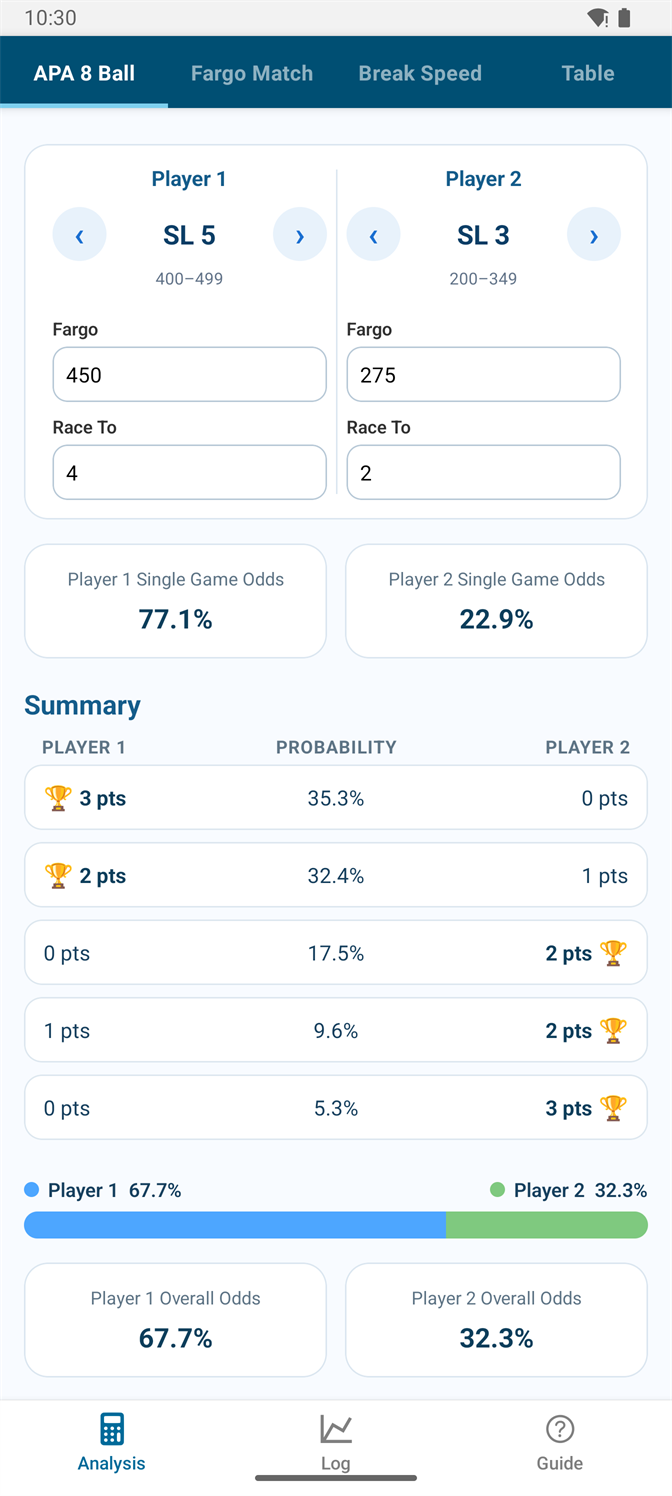
Set both skill levels and the app fills in everything else: the Fargo range that level covers, and the race each player is on from the Equalizer chart. Then it counts every way the match can end.

  • Single-game odds from the gap between the two Fargo ratings.
  • Every possible score line, each with its own probability — not just a win percentage, but how likely 3–0 is against 2–1.
  • APA match points for each score line, on the three-point scale, so you can see which results are worth playing for rather than only which are likely.
  • Overall match odds and expected match points for both players.
  • Skill level steppers set the race automatically, and you can override the Fargo rating or the race if you know better.

Useful for captains deciding a lineup, and for working out whether a mismatch on paper is really as lopsided as it looks.

APA 8 Ball screen: an SL5 against an SL3, showing 67.7% overall odds for player 1 and a table of score lines with probabilities
An SL5 against an SL3 — the race is 4 to 2, and the SL5 wins 67.7% of the time.
Analysis

Fargo Match — for races that aren't APA races

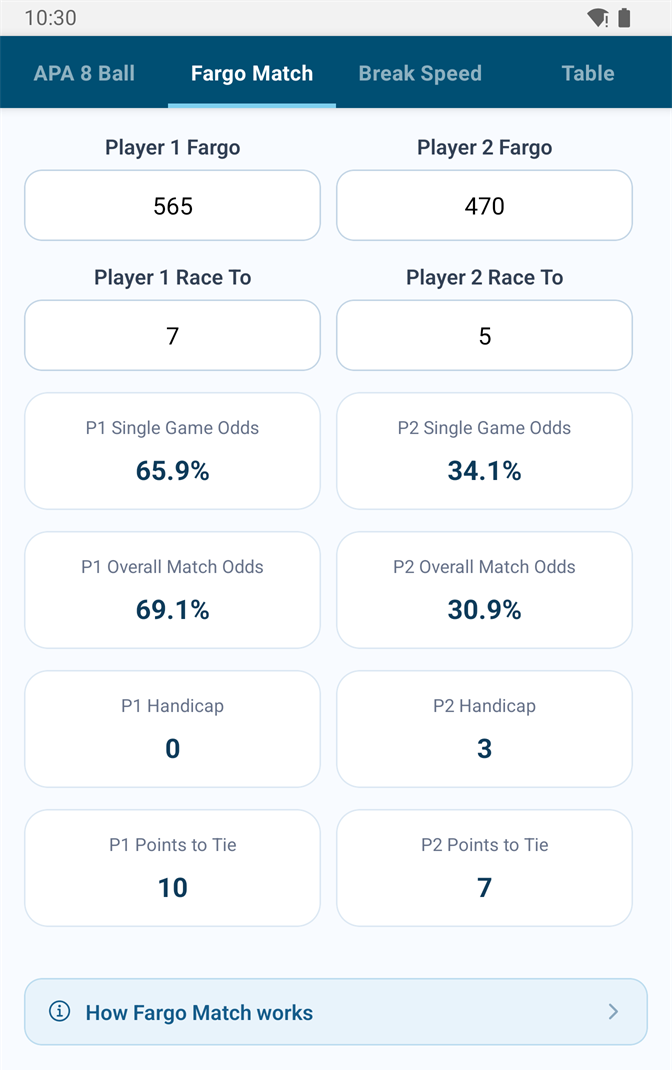
The same odds engine, driven straight off two Fargo ratings, with race lengths you set yourself — anything up to a race to 50. Built for tournament brackets, gambling sets, and any league that handicaps on Fargo instead of APA skill levels.

  • Single-game and whole-match odds for any pair of ratings and any two race lengths.
  • A games handicap in the BCA style, so you can propose a fair spot instead of arguing about one.
  • Points to tie on a 17-point scale, for formats scored that way.
Fargo Match screen: a 565 against a 470 in a race to 7 versus 5, showing 69.1% match odds and a 3-game handicap
A 565 giving up weight to a 470: 69.1% to win, or a 3-game spot to even it out.
Analysis + Log

Break Speed — your phone as a radar gun

You don't need a radar gun to know how hard you break. You need the distance the cue ball travelled and the time it took. Pool Captain gets the distance from the table and the time from the two cracks your break makes: the tip hitting the cue ball, and the cue ball hitting the rack.

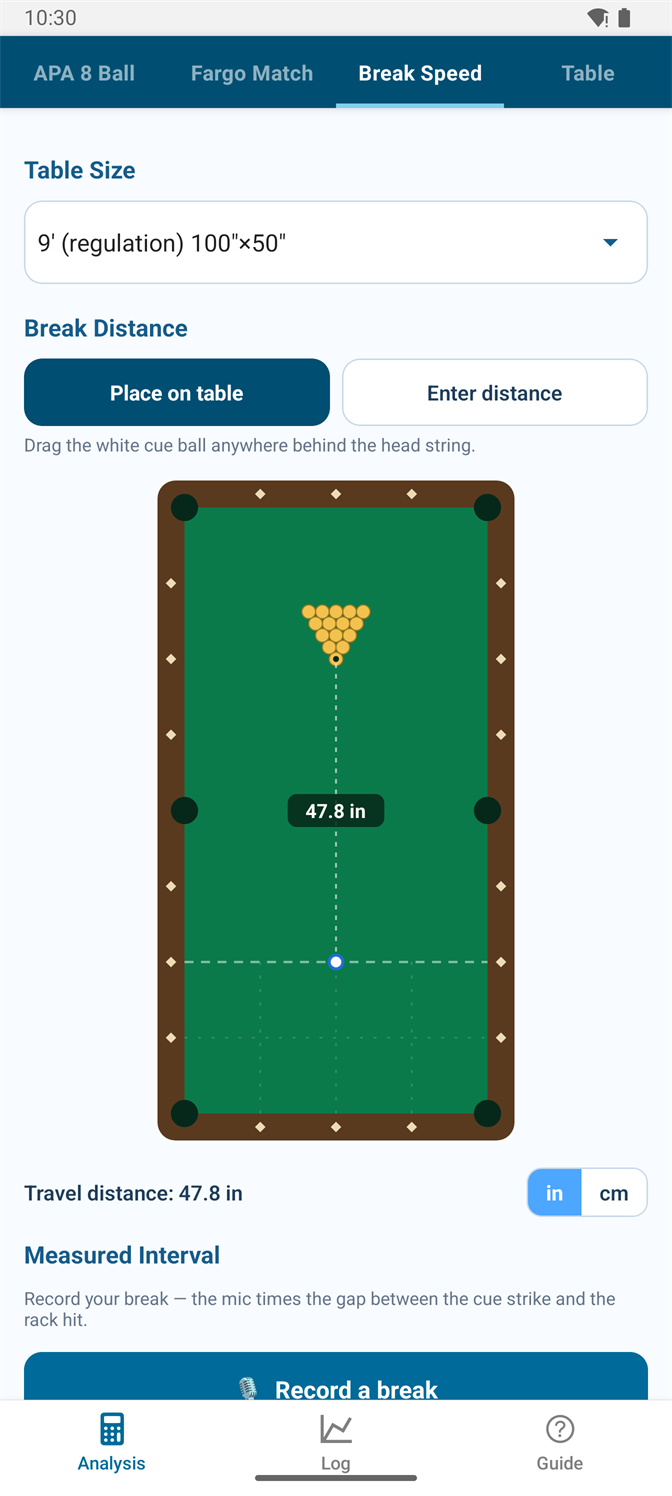
Setting up the distance

  • Table presets from a 6-or-7-foot bar box up to a 12-foot table.
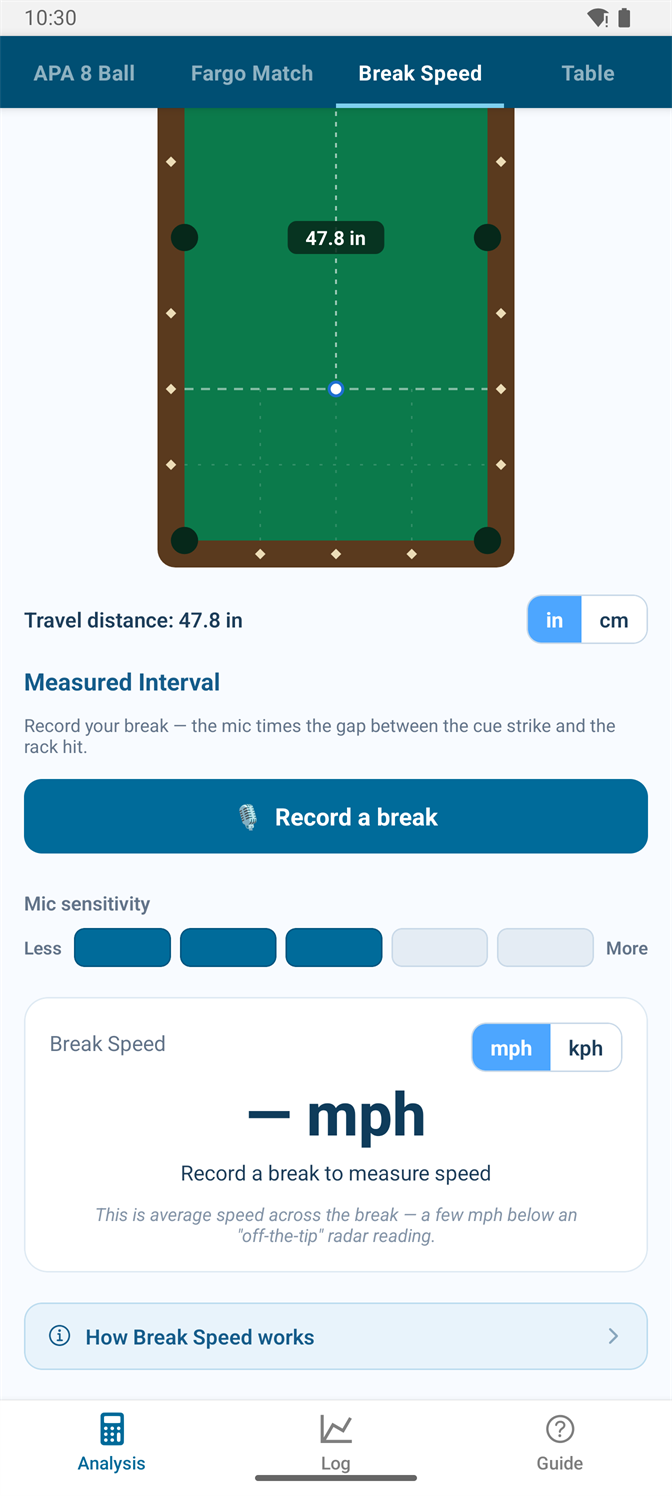
  • Drag the cue ball anywhere behind the head string — it won't let you place it illegally — and the travel distance to the rack updates as you move. Move it to the rail for a cut break.
  • Or just type a distance, in inches or centimetres.

Timing the break

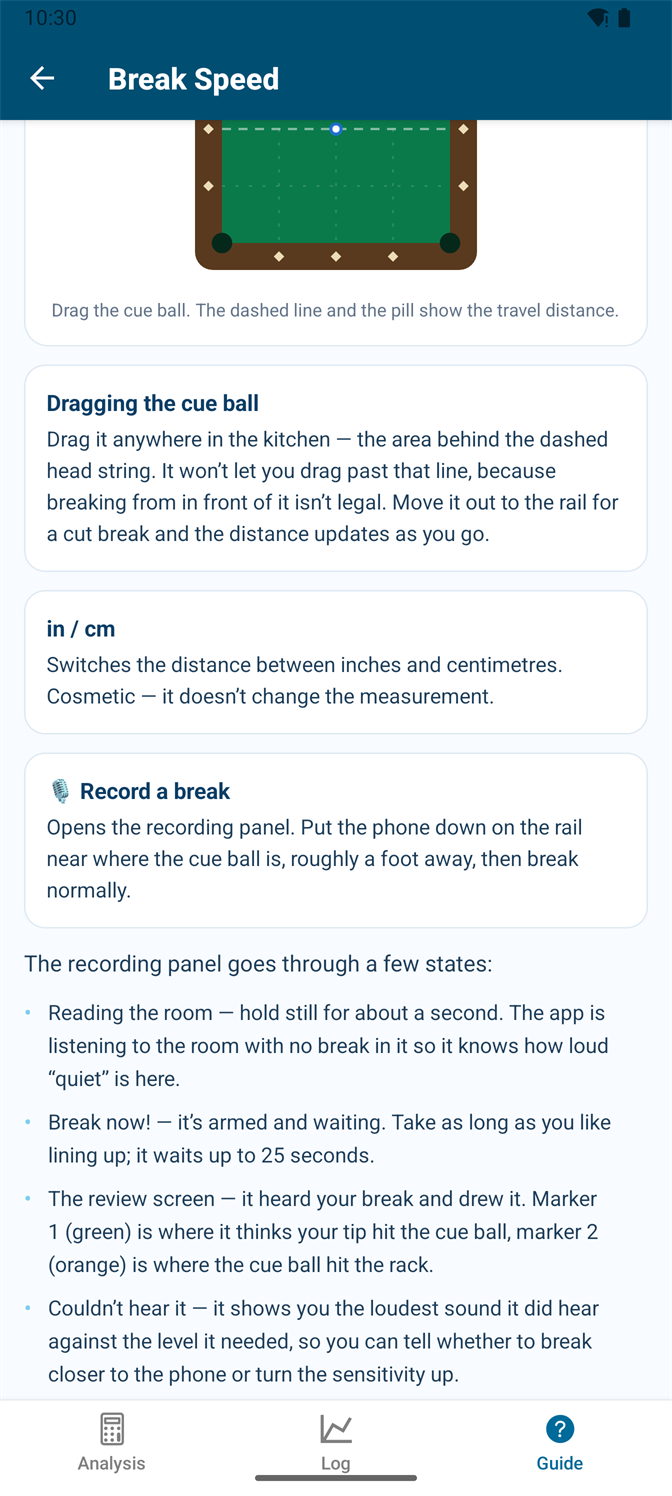
  • Put the phone on the rail, hit Record a break, and break normally. It reads the room's noise floor first so a loud bar doesn't fool it, then waits up to 25 seconds while you line up.
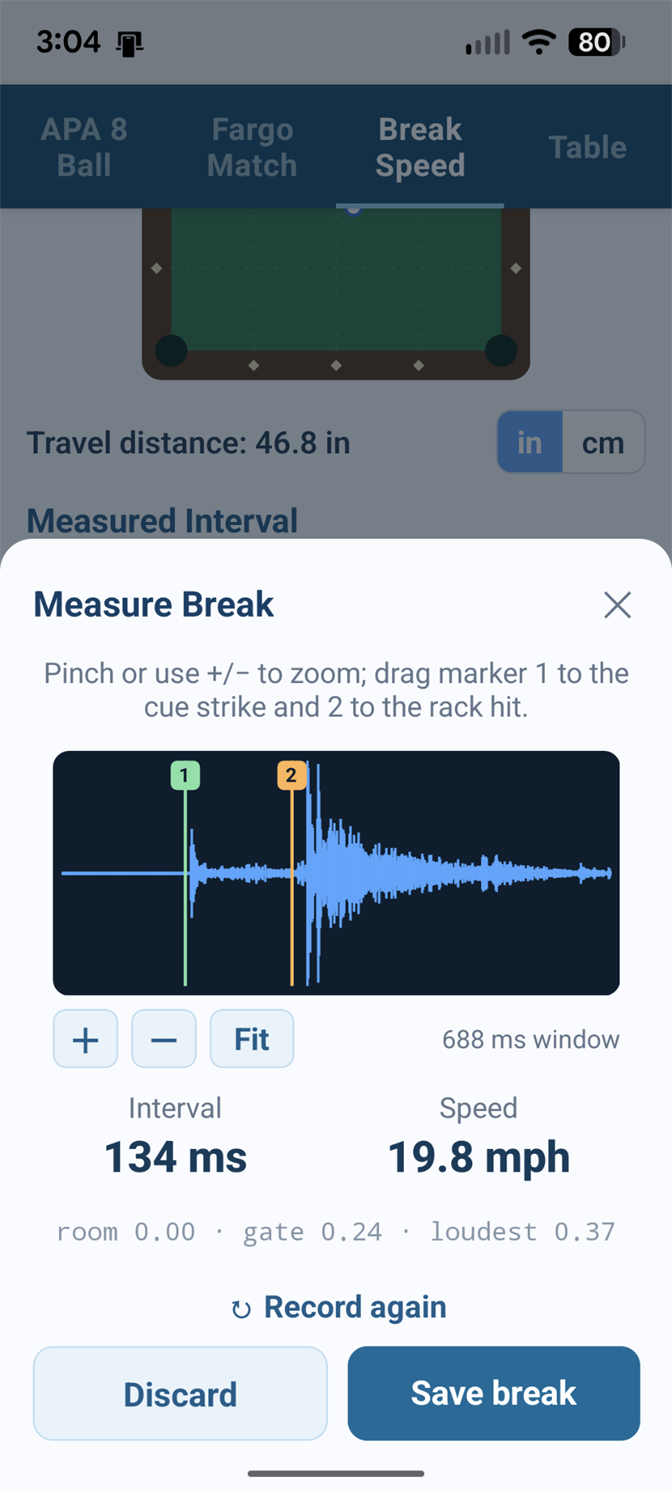
  • It shows you the waveform it heard with a marker on each crack. If it put one in the wrong place, drag it — zoom in with + and −, and the interval and speed update as you drag.
  • A confidence warning appears when it isn't sure it found the cue strike, rather than quietly reporting a wrong number.
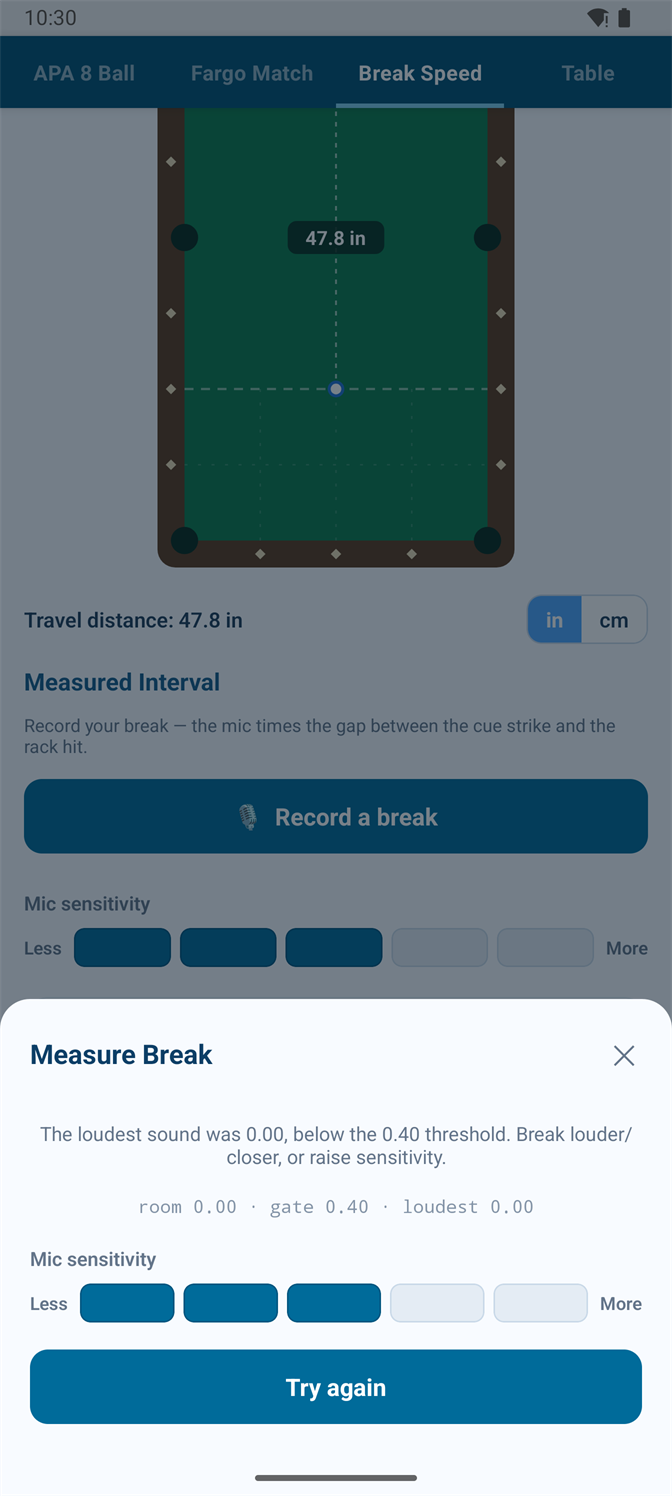
  • Five sensitivity steps, and when it hears nothing usable it tells you the loudest sound it did hear against the level it needed — so you know whether to break closer or turn it up.
  • Result in mph or km/h, with an honest note that this is average speed across the break, a few mph under what a radar gun reads off the tip.
Break Speed screen with a 9-foot table diagram and the cue ball dragged to show a 47.8 inch travel distance
Drag the cue ball; the distance to the rack follows.
The Measure Break review screen after a real break: a waveform with marker 1 on the cue strike and marker 2 on the rack hit, reading an interval of 134 ms and a speed of 19.8 mph
A real break, as the app heard it: 46.8″ in 134 ms — 19.8 mph. Marker 1 is the cue strike, marker 2 the rack.
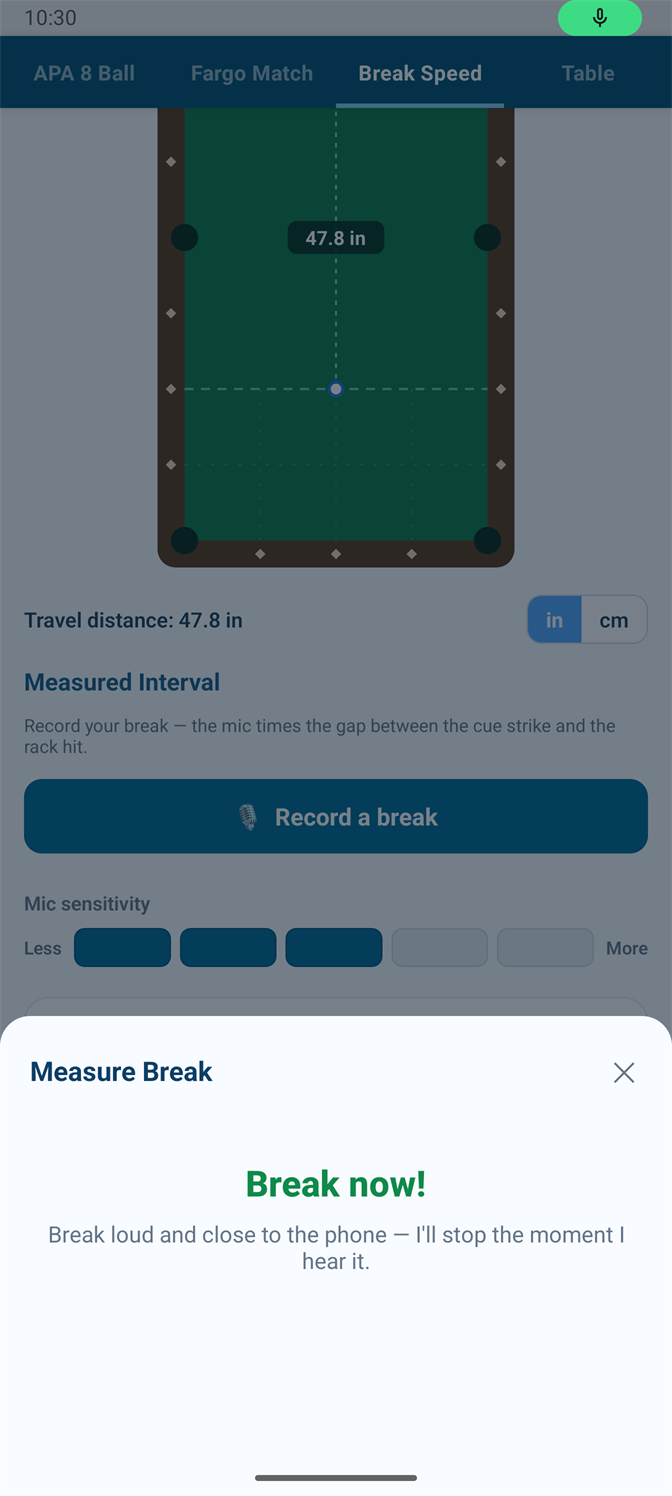
The Measure Break panel showing the armed state, reading Break now
Armed and waiting.
The Measure Break panel after hearing nothing, showing room, gate and loudest levels with the sensitivity control
When it hears nothing, it shows its working.
The lower half of the Break Speed screen: the record button, the five-step mic sensitivity control, and the break speed result card
Sensitivity, and the result in mph or km/h.
Log

Break Log — is your break getting better?

Every measured break can be saved, and the log turns them into a trend instead of a number you forget by next Tuesday.

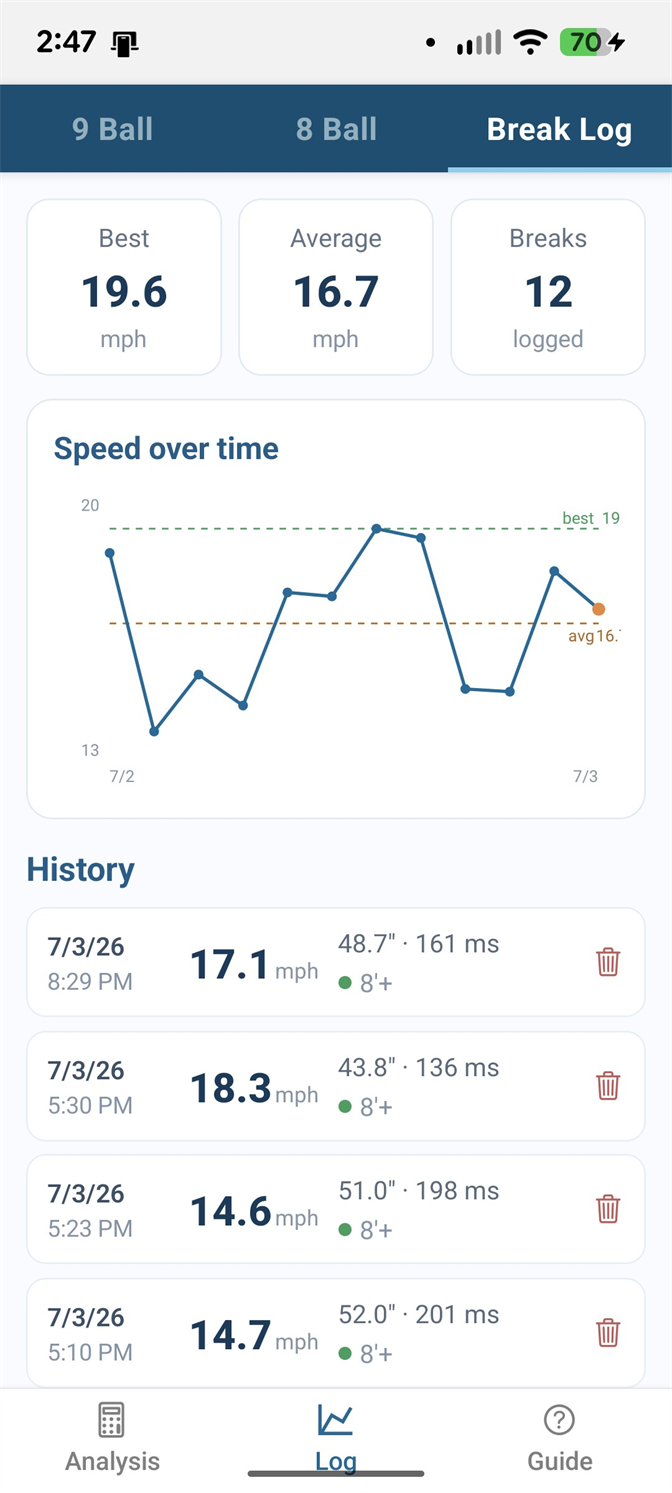
  • Best, average, and total across everything you've logged.
  • A speed-over-time chart with your best and average marked.
  • Per-break rows showing the date, the speed, the distance and interval behind it, which table it was measured on, and a confidence dot so a shaky reading is visible as one.
  • Delete any break, with an undo if you didn't mean it.
The Break Log showing a best of 19.6 mph, a 16.7 mph average over twelve logged breaks, a speed-over-time chart, and history rows giving each break's speed, distance and interval
Twelve real breaks measured on an 8-foot table: best 19.6 mph, averaging 16.7.
Analysis

Table — how tough is the table you're on?

A 0.90 bar box and a 1.20 tournament table are not the same game, and your percentages shouldn't be compared as if they were. This rates the table in front of you using Dr. Dave Alciatore's Table Difficulty Factor, from four measurements you can take with a tape measure.

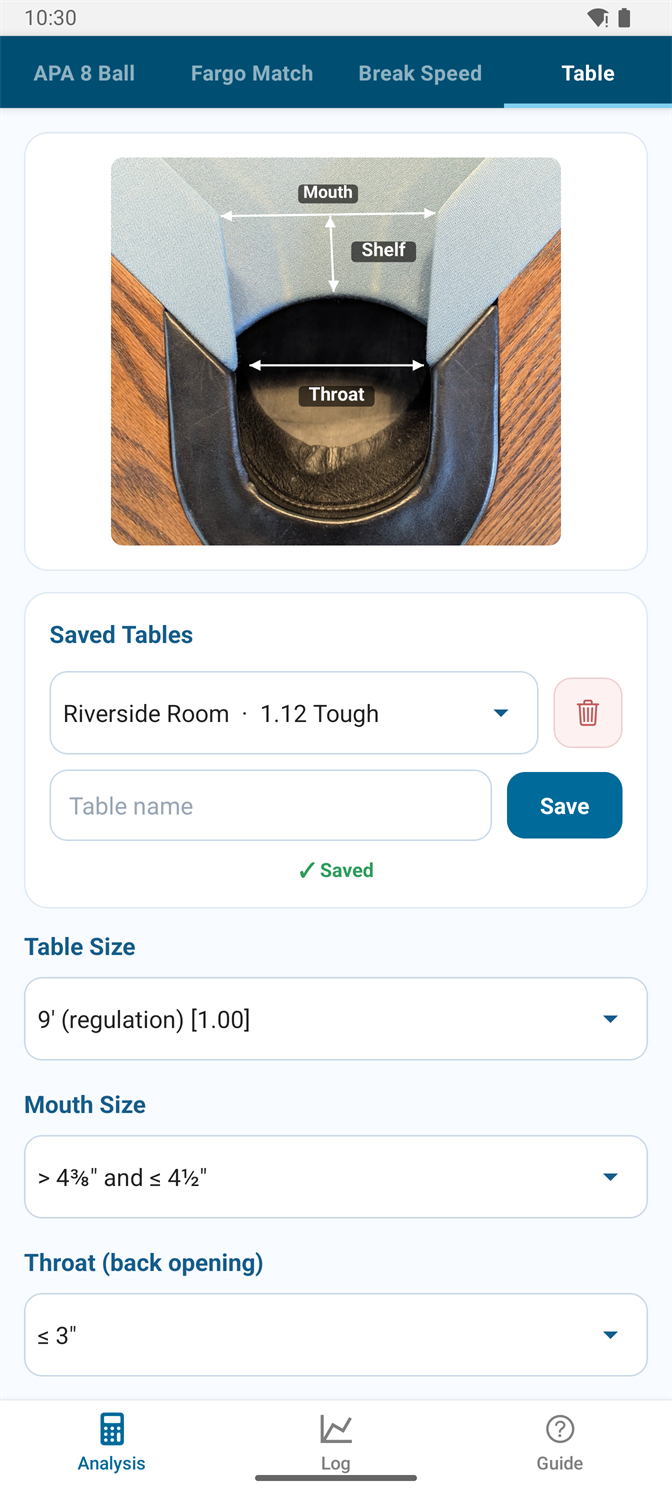
  • An annotated pocket photo showing exactly what mouth, throat, and shelf mean, because those are the measurements people get wrong.
  • Pick your table size, mouth width, throat, and shelf depth from ranges rather than needing exact figures.
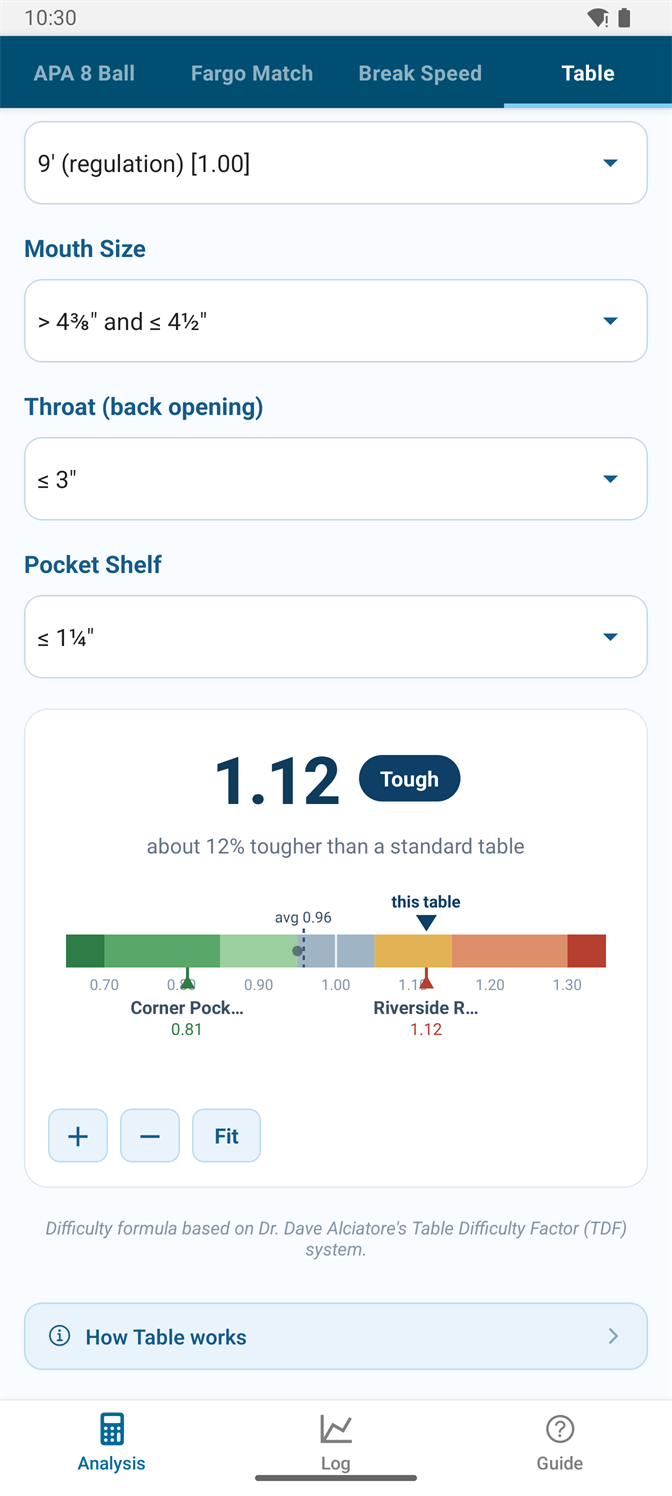
  • Get a TDF number and a verdict — Too Easy through Too Tough — plus a plain sentence like "about 12% tougher than a standard table".
  • Save each room you play in by name. The difficulty bar then shows your easiest and hardest tables, your average, and where the table you're rating now falls between them.
The Table screen showing an annotated photo of a pocket with mouth, shelf and throat labelled, above a saved tables picker
Mouth, shelf, throat — labelled on a real pocket.
A table rated 1.12 Tough, about 12% tougher than standard, with a difficulty bar comparing three saved rooms
1.12, Tough — and 38% harder than the bar box down the road.
Log

APA 9 Ball Logging — the level your pace really says

Your handicap is what the league assigned you. Your scoring pace is what you're actually doing. Log your matches and the app works out both, so you can see a bump coming instead of being surprised by it.

  • Log a match in a few taps: date, skill level, innings, defensive shots, points scored, match points, win or loss.
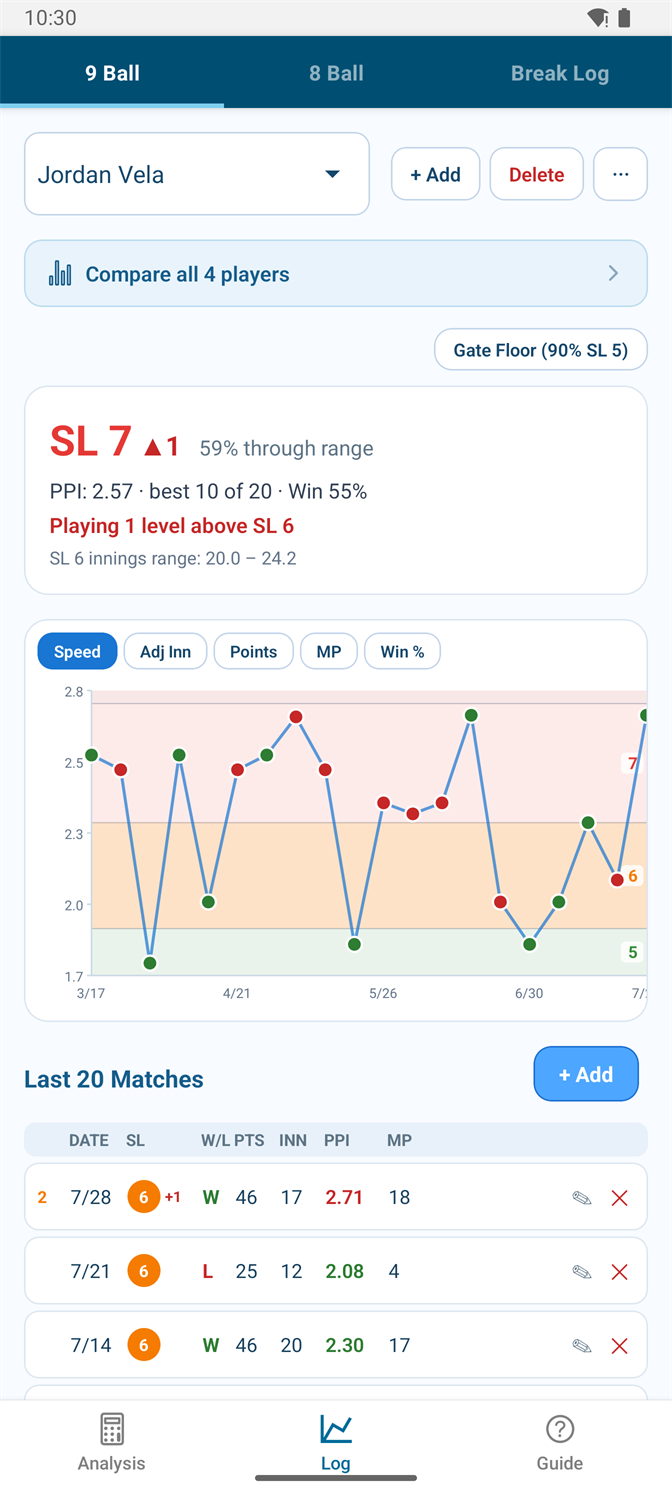
  • It computes your points per inning over the best 10 of your last 20 — the same window the league's own scoring logic leans on — and turns that into the skill level you're performing at, with how far through that level you are.
  • A red or blue says how far above or below your assigned level you're playing, in levels rather than jargon.
  • A chart of every match with the skill-level bands shaded behind it, so a good night and a bad night are visible at a glance. Switch it between pace, adjusted innings, points, match points, and win rate.
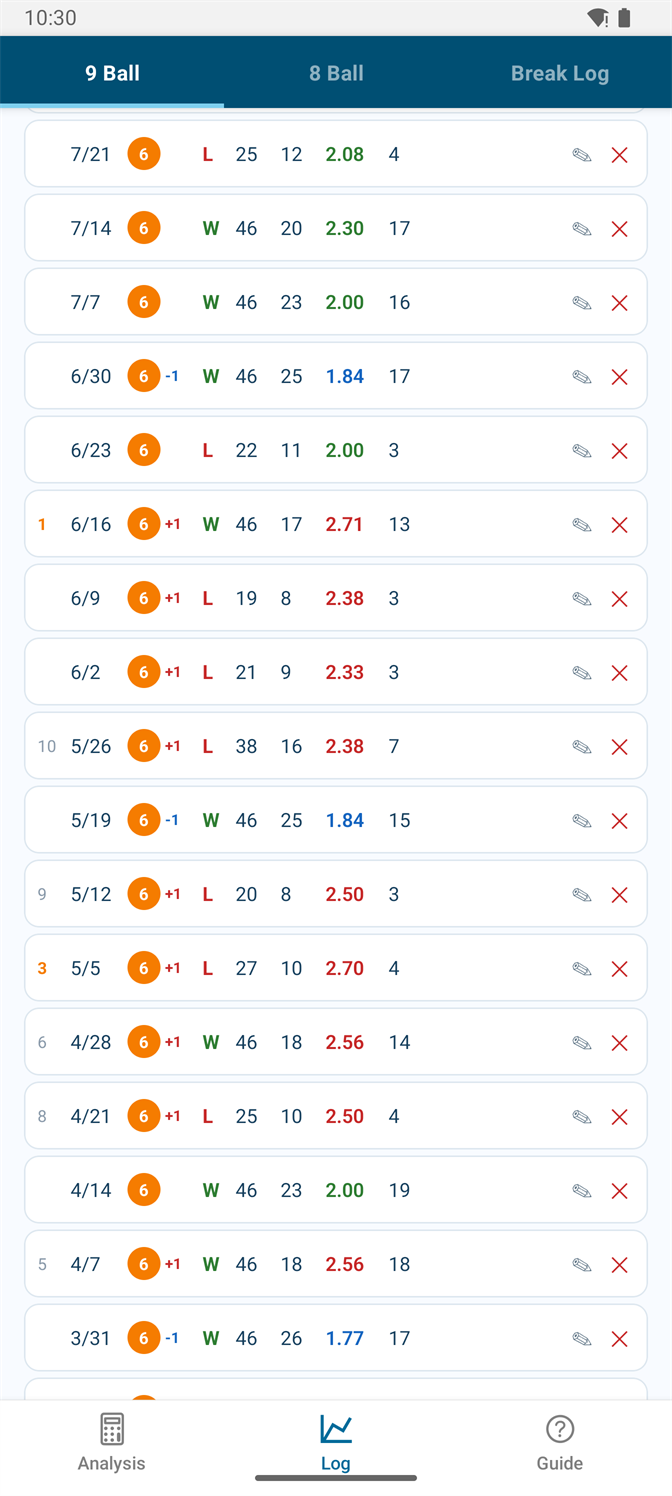
  • The match table flags which matches are counting (ranked 1–10) and which one is about to age out of your window.
  • A Gate Floor toggle shows what your numbers look like under the floor the league applies to a player at the level below.
9 Ball tracker showing a player performing at SL7 while assigned SL6, with a points-per-inning chart over shaded skill bands
Assigned SL6, playing at SL7, 59% of the way through the range.
The 9 Ball match table listing twenty matches with rank badges, win/loss, points, innings and points-per-inning
Twenty matches, with the counting ten ranked.
Log

Compare the whole team on one axis

Once you're logging more than one player — a whole roster, if you're a captain — the comparison view ranks everybody against the pace expected at their own level.

  • Every player's bar sits against their own skill band, so an SL3 and an SL7 can be read side by side without the SL7 automatically looking better.
  • Colour says the story at a glance: pushing up, holding, or soft against their level.
  • Switch between recent form (everything in the last 20) and what they're graded on (the best 10), because those answer different questions.
  • Tap a name to jump straight into that player's match history.
9-Ball Player Performance comparison showing four players ranked with bars against the APA speed bands
Four players, one axis, each against their own band.
Log

APA 8 Ball Logging — innings per win, done properly

8-ball has no points, so pace means innings. The catch is that innings are shared between both players and the Equalizer gives everyone a different race, which is what makes a raw innings-per-win number so easy to misread. This handles both.

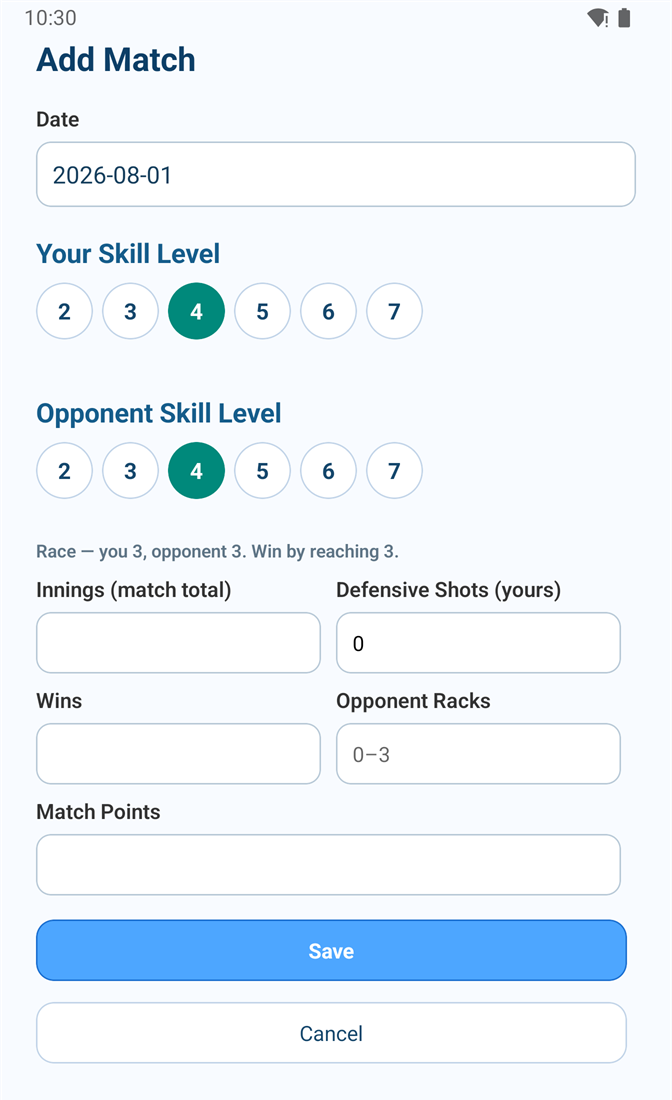
  • Log your skill level and your opponent's — the form shows you the race both players are on, so the Wins field is never ambiguous.
  • Records innings, your defensive shots, racks you won, racks the opponent won, and match points. Opponent racks are optional; leave it blank and the app is honest about what it can't then compute.
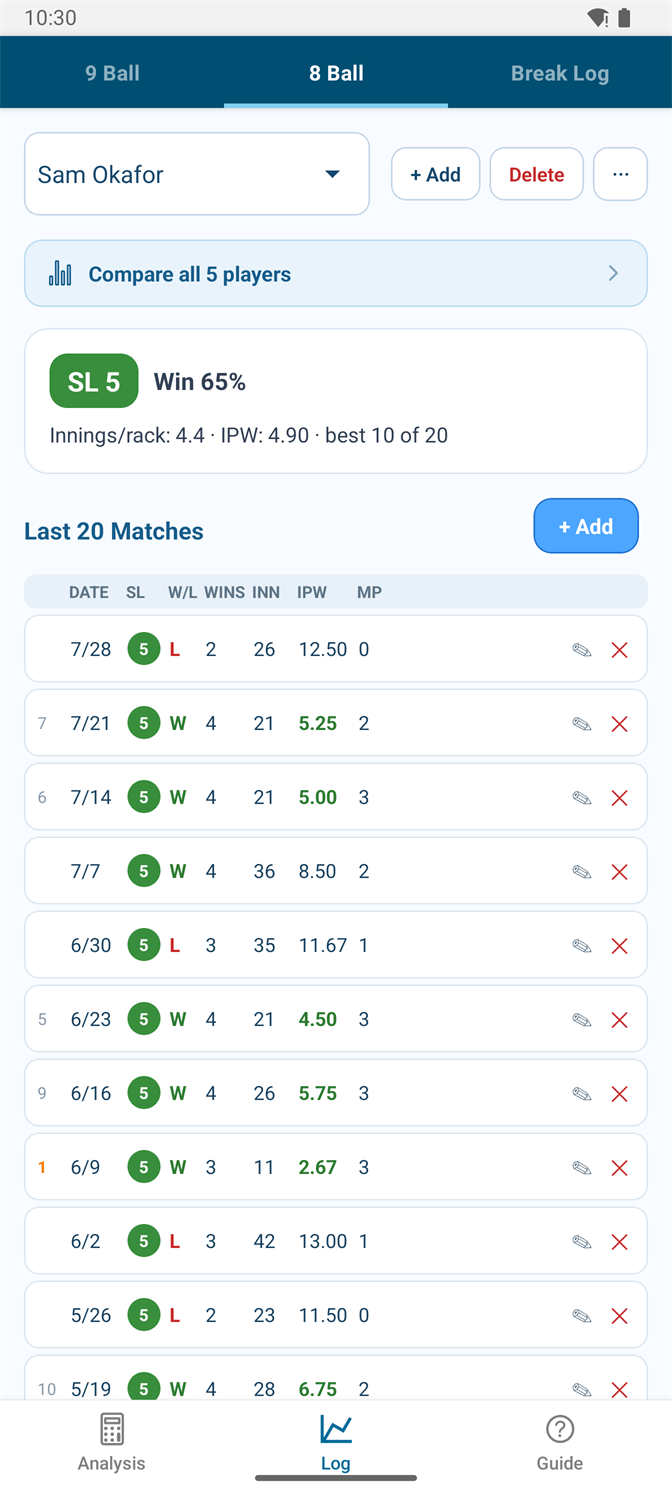
  • Reports innings per win, innings per rack played, and your win percentage over the best 10 of your last 20, with the counting matches ranked in the table.
  • A zero-rack match still costs you — its innings count, its wins don't. Losing badly isn't free, and the app doesn't pretend otherwise.
  • The comparison view grades every player against the innings-per-rack range expected at their own level, ranks the room fastest first, and flags anyone far enough ahead of their level to be on bump watch.
8 Ball tracker for an SL5 with a 65% win rate, 4.4 innings per rack and 4.90 innings per win over twenty matches
SL5, 4.4 innings per rack, ranked matches marked.
The Add Match form showing skill level pickers for both players and the race it derives from them
Entry form. The race comes from both levels.
Everywhere

The Guide — no number without an explanation

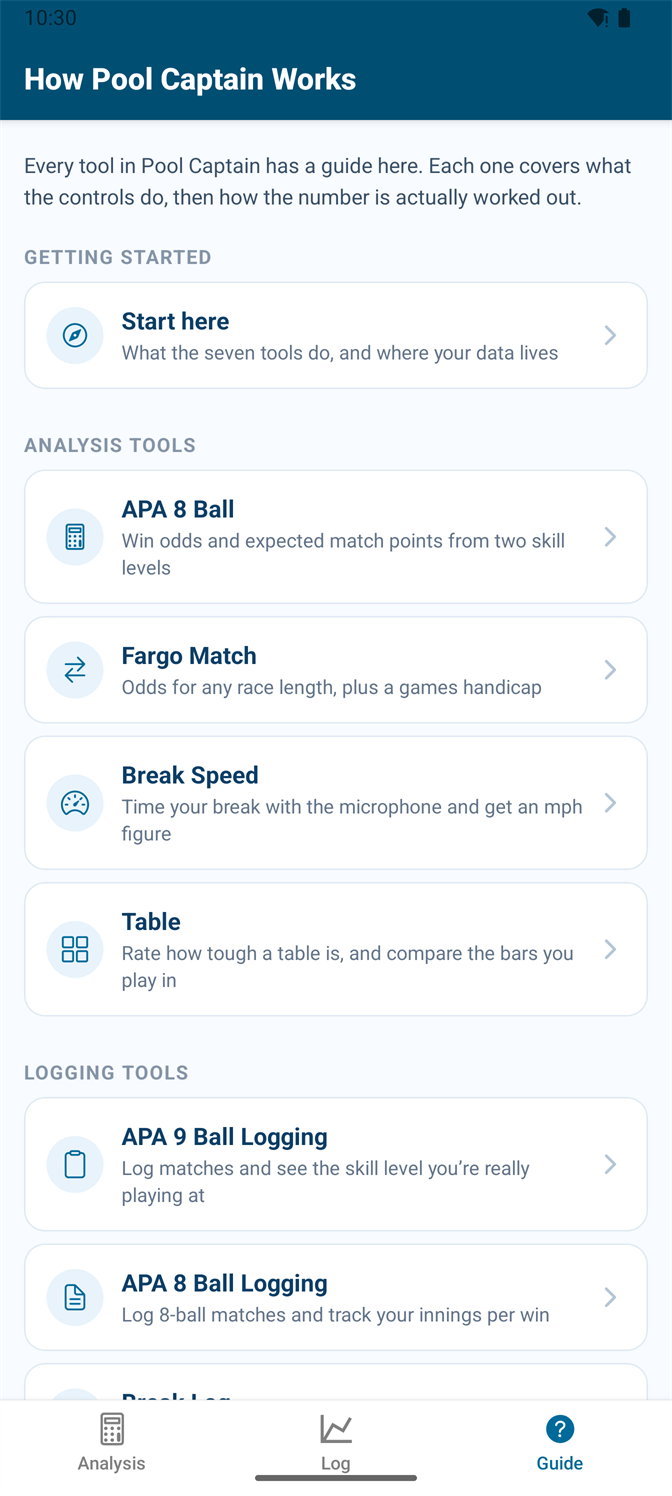
Every tool has a written guide, reachable from the bottom of the screen you're on. Each one covers what the controls do, then how the number is actually worked out — including where a figure is an estimate and where it's a rule straight out of the APA scoresheet.

  • Seven guides, in plain language, with diagrams and worked examples.
  • Honest about its own limits: which values are calibrated estimates, and which parts of the detection can get things wrong.
  • No hunting for it — every screen links to its own guide.
The guide index listing Start here, and guides for each analysis and logging tool
One guide per tool.
A guide page explaining the recording panel states and what each marker means
Written for a player, not a developer.

Where your data lives

Short answer: on your phone, and nowhere else.

No account, no server

There's nothing to sign up for. The app makes no network requests of its own and works fully offline — try it in airplane mode. Your match logs, break history, and saved tables sit in the app's private storage on your device.

No ads, no analytics

No advertising, no usage tracking, no crash reporting, no third-party SDKs collecting anything. I don't find out that you used it, let alone how.

The microphone

Used only on the break-speed screen, only while it's listening. Audio is analysed in memory to find the timing of two impacts. No recording is saved or transmitted — what persists is a number.

Your data is portable

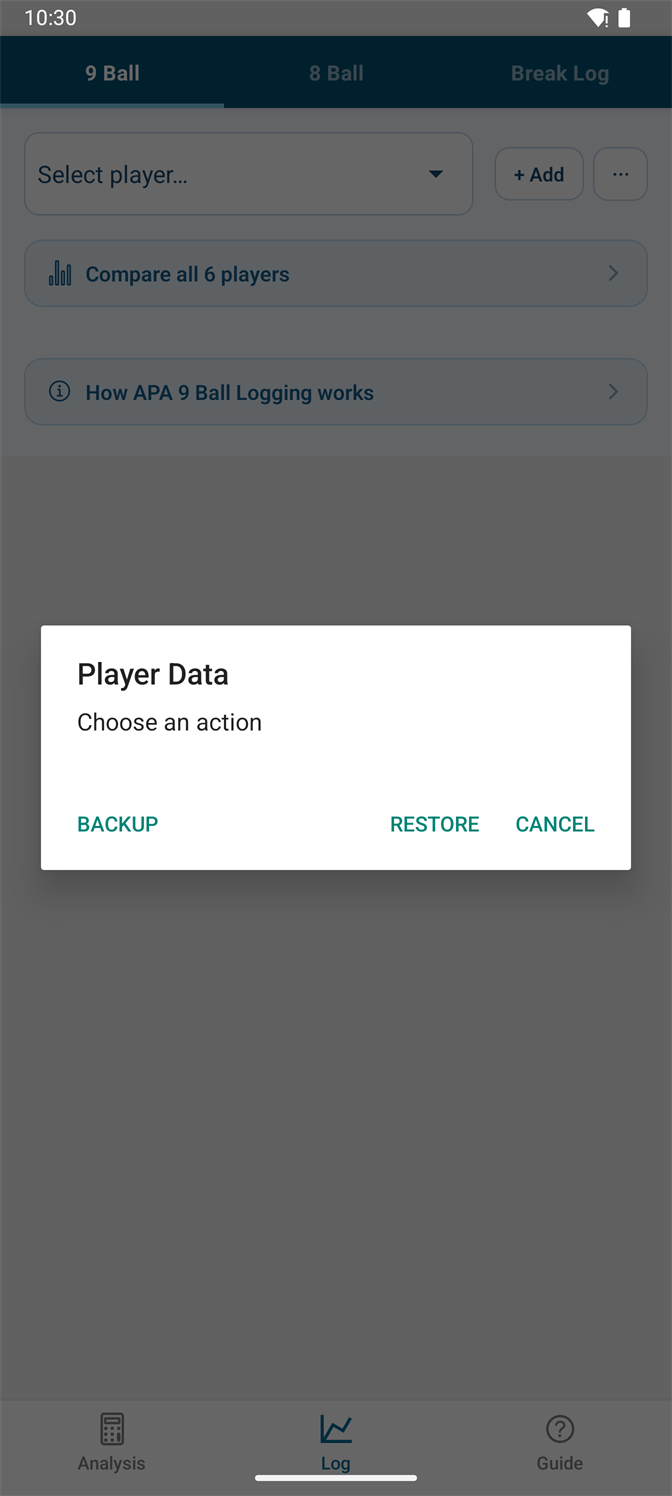
Both match logs can be exported as a plain JSON file through the share sheet, and restored on another phone. It's your data, in a format you can read.

The Player Data dialog in the app offering Backup, Restore and Cancel
Backup and restore are yours to run, whenever you want a copy.

The full policy is here: Pool Captain privacy policy.

Things you should know before you install

It's an early build

That's the point of a test. Expect rough edges. Two known ones: a chart label can clip at the right edge of the break trend, and restoring a backup file into the wrong tracker will fill it with nonsense rather than refusing.

Some numbers are estimates, and the app says so

The APA race charts and 9-ball point requirements are transcribed from APA's own materials. The skill-level bands the comparison screens grade you against are calibrated estimates worked out from match data — they are not published APA figures, and the guide is explicit about which is which.

The players on this page are invented

Every name and logged match here is fabricated for illustration. The numbers are internally consistent — they were generated to be a plausible logbook and then run through the app's own calculations — but nobody's real record is shown anywhere. The two exceptions are the break measurement and the break log, both genuine captures from my own phone; they carry speeds, not people.

It isn't affiliated with anyone

Pool Captain is an independent app, not affiliated with, endorsed by, or sponsored by the American Poolplayers Association, Fargo Rate, or any league operator. It's one person's side project.
Ready?

The form asks your name, what you play, and whether you can keep the app installed for the fourteen days — plus the email address on your Android phone, which is the one thing I genuinely need to reach you.

Sign up to test

Questions first is fine too — email me and tell me what you play and what you'd want out of it.